
In my view, learning tokenomics is less about memorizing a few supply numbers and more about understanding where future token supply comes from, who controls it, and whether the network creates enough real demand to absorb it.
Decoding the DNA of Crypto Economies
What does tokenomics actually mean?
If you are new to crypto, the word tokenomics can sound more complicated than it really is.
It is simply a combination of “token” and “economics.”
At its broadest, tokenomics describes the economic rules surrounding a digital asset: how many tokens exist, how new ones enter circulation, who receives them, what they are used for, whether some are permanently removed, and what incentives encourage people to hold or spend them.
That is why I don’t think it is particularly useful to look at tokenomics as nothing more than a supply chart.
A token can have a fixed maximum supply and still have weak economics. Another token can have an inflationary supply and still support a functioning network if newly issued tokens are being used to compensate validators, secure infrastructure, or incentivize activity that creates genuine demand.
The important question is therefore not simply:
“How many tokens are there?”
A better question is:
“How does the entire economic system behave as the network grows?”
That distinction becomes incredibly important when you start comparing projects.
For example, the tokenomics of a blockchain with proof-of-stake validators looks very different from a governance token for a decentralized application. A gaming token may prioritize in-game spending and rewards, while a DeFi token might be designed around governance, collateral, liquidity incentives, or protocol fee mechanisms.
As CoinMarketCap’s tokenomics glossary explains, tokenomics can encompass a token’s usage within an ecosystem as well as its monetary policy and distribution mechanisms. (CoinMarketCap)
So when you evaluate a crypto project, think of tokenomics as the project’s economic operating system.
The blockchain code tells you what the network can technically do.
Tokenomics tells you how economic incentives are supposed to make people actually do it.
The four pieces I look at first
When I personally break down a token’s economics, I like to organize the analysis into four simple buckets:
| Component | What you are really asking |
|---|---|
| Supply | How many tokens exist, and how quickly can that number change? |
| Distribution | Who owns the tokens, and how concentrated is ownership? |
| Utility | Why would anyone actually need the token? |
| Incentives | What motivates users, validators, developers, and investors to participate? |
These four categories interact constantly.
Imagine a project launches with 100 million tokens, but only 10 million are circulating. On paper, the token may look scarce. However, if the remaining 90 million tokens are scheduled to unlock over the next few years, the economic picture is very different.
Now add another layer.
Suppose those tokens are released while actual user demand remains flat.
You have increasing supply without a corresponding increase in demand. That does not automatically mean the token price must fall-markets are more complicated than that-but it creates a potential source of dilution that you should understand before forming an opinion about the asset.
This is why I always prefer looking at supply schedules and incentives together, rather than treating a token’s current circulating supply as the entire story.
The basic tokenomics dashboard
A useful first-pass checklist looks like this:
- Circulating supply
- Total supply
- Maximum supply
- Current inflation or emission rate
- Future token unlocks
- Team and investor allocations
- Treasury holdings
- Token utility
- Burn or buyback mechanisms
- Staking or validator rewards
- Governance rights
- Protocol revenue and value capture
You don’t necessarily need to become an economist to understand these variables.
You just need to follow the flow of tokens.
Who receives them?
When do they receive them?
Why do they receive them?
And, perhaps most importantly, what happens after they receive them?
Supply Metrics Demystified: Circulating vs. Total vs. Maximum Supply

One of the easiest ways to misunderstand a cryptocurrency is to look at a single supply number without asking what that number actually represents.
Crypto data websites commonly show circulating supply, total supply, and maximum supply, but these are not interchangeable concepts. CoinMarketCap, for example, defines circulating supply as an approximation of assets circulating in the market and distinguishes it from total and maximum supply. (Hỗ trợ CoinMarketCap)
Let’s separate them.
Circulating supply
Circulating supply is the approximate number of tokens currently available in the market and in the hands of the broader public.
Think of it as the token’s current economic float.
If a project has a total supply of 1 billion tokens but only 100 million are considered circulating, the market is currently pricing the asset against a much smaller quantity than the eventual supply.
That difference can become extremely important.
Circulating supply can also change.
New tokens can enter circulation through:
- Mining rewards
- Staking rewards
- Vesting unlocks
- Treasury distributions
- Ecosystem incentives
- Token emissions
- Other protocol-specific issuance mechanisms
Supply can also decrease through token burns or other permanent removal mechanisms.
This is why supply is not necessarily a static number. In many ecosystems, it behaves more like a moving economic variable.
Total supply
Total supply generally refers to the amount of tokens that have already been created, after accounting for tokens that have been verifiably burned.
It can therefore include tokens that exist but are not currently circulating.
For example, tokens held in a vesting contract may already be part of total supply even though their recipients cannot sell them yet.
That distinction is easy to overlook.
A token can have:
- 1 billion total supply
- 300 million circulating supply
- 700 million tokens locked or otherwise not circulating
Looking only at the 300 million circulating figure could give you an incomplete picture of the asset’s future supply.
CoinMarketCap specifically notes that total supply can include locked tokens and that it differs from circulating supply because not every created token is currently available for use in the market. (CoinMarketCap)
Maximum supply
Maximum supply is the theoretical upper limit on the number of tokens that can ever exist, assuming the protocol actually enforces such a limit.
Bitcoin is the classic example.
Its protocol is designed around a maximum supply of 21 million BTC, which is one of the most recognizable examples of a hard supply cap in crypto. (CoinMarketCap)
But not every cryptocurrency has a maximum supply.
Ethereum, for example, does not have a fixed maximum supply in the same way Bitcoin does. Its supply changes through the interaction between validator issuance and the burning of transaction fees. Ethereum’s documentation explains that these two forces determine whether ETH supply grows or contracts over time. (ethereum.org)
That gives you an important lesson:
“Unlimited supply” does not automatically mean “bad tokenomics,” just as “fixed supply” does not automatically mean “good tokenomics.”
The actual issuance rate, demand, utility, and economic incentives matter.
The three supply metrics at a glance
| Metric | Simple definition | Why it matters |
|---|---|---|
| Circulating Supply | Tokens currently considered in circulation | Used for conventional market-cap calculations |
| Total Supply | Tokens already created, minus verified burns | Shows how much supply exists today |
| Maximum Supply | Theoretical maximum number of tokens | Helps estimate long-term scarcity |
There is another wrinkle worth knowing: circulating supply is an estimate, not a perfect measurement of every token that could theoretically move.
CoinMarketCap itself points out that circulating supply is an approximation and should not simply be treated as identical to “all unlocked tokens.” (Hỗ trợ CoinMarketCap)
That distinction becomes particularly useful when you start analyzing low-float tokens.
Market Cap vs. Fully Diluted Valuation
This is where tokenomics starts becoming much more practical.
Suppose a token trades at $2.
If 50 million tokens are circulating, the conventional market capitalization is:
$2 × 50 million = $100 million
Now imagine the project has a maximum supply of 1 billion tokens.
The theoretical fully diluted valuation would be:
$2 × 1 billion = $2 billion
Same token.
Same market price.
Two very different valuation figures.
That is the basic difference between market capitalization and Fully Diluted Valuation (FDV).
CoinMarketCap defines market capitalization using circulating supply and FDV using maximum supply. (CoinMarketCap)
| Metric | Formula | What it tells you |
|---|---|---|
| Market Cap | Price × Circulating Supply | Approximate current market valuation |
| FDV | Price × Maximum Supply | Theoretical valuation if maximum supply were represented |
Why FDV can change the conversation
Imagine you discover a newly launched token with:
- Price: $1
- Circulating supply: 50 million
- Maximum supply: 1 billion
The token’s market cap is only $50 million.
At first glance, that may sound tiny.
But the FDV is $1 billion.
That means the market is effectively valuing the eventual token supply at twenty times the current circulating valuation.
Now, that does not mean the token is necessarily overpriced.
Maybe the project has enormous growth ahead. Maybe future demand will absorb the new supply. Maybe most of the remaining tokens are allocated to ecosystem development over many years.
But the gap is something you should investigate.
I like to think of FDV as a future supply stress test, rather than a magic valuation metric.
It asks:
“If today’s price were applied to the future supply, what valuation would this project imply?”
That can be a useful reality check.
The Danger of Unlock Cliffs: Vesting Schedules and Distribution

This is one of the areas where tokenomics can become genuinely interesting-and occasionally uncomfortable.
A project’s token distribution may look harmless when you only examine today’s circulating supply.
Then you open the vesting schedule.
Suddenly, the picture changes.
How token vesting works
Early investors, founders, employees, advisors, and strategic partners often receive allocations that are subject to vesting.
Rather than receiving all of those tokens immediately, they become available according to a predetermined schedule.
A common structure combines a cliff with a subsequent linear vesting period.
For example:
- Team receives 10 million tokens.
- No tokens unlock for 12 months.
- At month 12, a portion unlocks.
- The remaining allocation then unlocks gradually over several years.
This structure attempts to align the interests of early stakeholders with the longer-term development of the project.
Tokenomist describes vesting as a time-based mechanism that gradually releases tokens to stakeholders and identifies cliff and linear releases as two common structures. (Tokenomist)
The underlying idea is straightforward:
If you helped build the project, you should have an incentive to remain involved rather than receiving everything on day one.
Of course, a vesting schedule doesn’t guarantee that insiders will behave in a particular way.
It simply determines when their tokens become available.
Cliff unlocks vs. linear unlocks
| Structure | How it works | Potential market effect |
|---|---|---|
| Cliff | Large amount unlocks at a specific date | Can create a sudden increase in available supply |
| Linear | Tokens unlock gradually | Spreads potential supply pressure over time |
| Hybrid | Combines cliff and linear releases | Common for team and investor allocations |
This is why I strongly recommend checking the unlock calendar whenever you are researching a token.
A project can have impressive technology, active developers, and growing users, yet still face substantial supply expansion.
The question is whether demand grows quickly enough to absorb that expansion.
The low-float, high-FDV problem
One of the most discussed tokenomics structures is the low-float, high-FDV model.
Here’s the basic setup:
A project launches with a small percentage of its eventual supply circulating, while the token price implies a very large FDV.
For example:
- 5% circulating
- 95% scheduled for future release
- $500 million market cap
- $10 billion FDV
That structure doesn’t automatically mean the project is doomed.
But you should recognize what it means economically.
There is potentially a huge amount of future supply that can become liquid.
And once those tokens become transferable, their owners have choices. They may hold them, stake them, use them in the ecosystem, provide liquidity, sell them, or transfer them elsewhere.
The unlock itself does not tell you which choice they will make.
It simply changes the set of available choices.
Tokenomist’s current tokenomics documentation emphasizes that unlock events increase available supply and that the economic effect depends heavily on the category of tokens being released and how recipients ultimately use them. (Tokenomist)
That’s an important nuance.
A $100 million ecosystem allocation does not necessarily behave like a $100 million investor allocation.
An ecosystem treasury might distribute tokens to developers or liquidity programs over time.
A private investor might have a completely different incentive structure.
So don’t just ask:
“How big is the unlock?”
Also ask:
“Who is receiving it?”
Economic Engines: Inflationary, Deflationary, and Value-Capture Models
Once you understand supply, the next question is demand.
This is where token utility enters the picture.
Token utility and demand drivers
A token needs a reason to exist.
That sounds obvious, but it is surprisingly easy to lose sight of when crypto narratives become dominated by price charts.
Depending on the protocol, a token may provide one or more forms of utility:
- Transaction fees: The token is required to pay for network activity.
- Governance: Holding the token gives users voting rights.
- Staking: Tokens are deposited to participate in network security.
- Collateral: The asset can be used to borrow or mint other assets.
- Access: Holding the token unlocks particular products, services, or features.
- Economic incentives: Tokens reward users who provide liquidity or other services.
- Value capture: Protocol economics may direct fees, burns, buybacks, or other benefits toward the token.
Not every token needs all of these.
In fact, adding unnecessary utility simply for marketing purposes can make an economic model more complicated without making it stronger.
The key is whether the utility creates real demand.
Imagine a network processes millions of transactions, but users can interact with everything without ever needing the native token.
That raises a natural question:
Where does token demand come from?
Contrast that with a network where the token is required to pay transaction fees, secure the network, provide collateral, or participate in governance.
The second model gives you a clearer connection between network activity and token usage.
That doesn’t automatically make the token more valuable, but it gives you something concrete to analyze.
Inflationary vs. deflationary tokenomics
The words inflationary and deflationary are often thrown around casually in crypto.
The basic concept is actually fairly simple.
A token is inflationary when its supply increases over time.
A token is deflationary when mechanisms reduce its supply, or when supply growth is negative over a given period.
But real crypto networks can sit somewhere in between.
A protocol may issue new tokens to validators while simultaneously burning some of the supply through transaction fees.
Ethereum provides a particularly clear example.
Under its current design, validators receive new ETH as rewards while EIP-1559 burns the network’s base transaction fee. Ethereum’s official documentation explains that the interaction between issuance and burning determines whether ETH supply increases or decreases at a given time. (ethereum.org)
This means you shouldn’t look at a token and simply say:
“It has inflation, therefore it’s bad.”
Instead, ask:
- How much is issued?
- Who receives the new tokens?
- Why are they issued?
- Is demand growing?
- Are some tokens being burned?
- What is the net supply change?
- Does the token provide economic value to its holders?
That’s a much more useful framework.
Burns and Buybacks: Creating Scarcity
Token burns are one of the most recognizable deflationary mechanisms in crypto.
A burn permanently removes tokens from the available supply, usually by sending them to an address or mechanism from which they cannot be recovered.
One of the best-known examples is Ethereum’s EIP-1559 mechanism, where the base fee paid by transactions is burned. The original EIP-1559 specification describes the base fee as being permanently removed from circulation. (Ethereum Improvement Proposals)
This creates an interesting relationship between network usage and token supply.
More network activity can mean more fees.
More fees can mean more tokens burned.
More burning can reduce net issuance pressure.
But-and this is important-a burn does not automatically create economic value.
Burning 1 million worthless tokens doesn’t suddenly create $1 million of economic value.
The token must have meaningful demand first.
This is why I prefer to think about burns as a supply-side mechanism, not a complete value proposition.
Buyback-and-burn models
Some projects use another approach.
The protocol or an associated entity uses revenue or treasury funds to purchase tokens from the market and then permanently removes those tokens.
Conceptually, this can create a loop:
Revenue → Buy tokens → Burn tokens → Reduce supply
If the protocol generates genuine revenue, the mechanism can create a clearer connection between economic activity and token scarcity.
But once again, context matters.
You should investigate:
- Where does the money come from?
- Is it genuine protocol revenue?
- Who controls the buyback?
- Is the mechanism guaranteed by code or dependent on governance?
- How much supply is actually removed?
- Does the token have meaningful demand beyond the buyback?
Tokenomics becomes much more interesting when you follow the entire loop instead of stopping at the word “burn.”
Value Capture: The Missing Piece in Many Token Models
One of the biggest mistakes beginners make is confusing protocol success with token success.
A decentralized application can have:
- millions of users,
- significant trading volume,
- substantial fees,
- strong developer activity,
and still have a token that captures very little of that economic activity.
That’s because the protocol and its token are not necessarily the same thing.
This is the concept of value capture.
A project may generate economic value without transferring that value to token holders.
For example, a token may only provide governance rights while protocol fees go somewhere else.
Another project may use revenue to buy tokens.
A third might distribute fees to stakers.
A fourth might burn part of the token supply.
These are very different economic designs.
When I’m analyzing a token, I therefore want to know:
“If this protocol becomes dramatically more successful, what mechanically happens to the token?”
That single question can reveal a lot.
If the answer is “nothing,” you need to understand why.
If the answer is “more people need the token for transactions,” that’s a demand mechanism.
If the answer is “protocol revenue is used to buy and burn the token,” that’s a value-capture mechanism.
If the answer is “token holders control governance,” that’s governance utility-but governance alone doesn’t necessarily guarantee financial value.
Red Flags: How to Spot Bad Tokenomics Before Investing
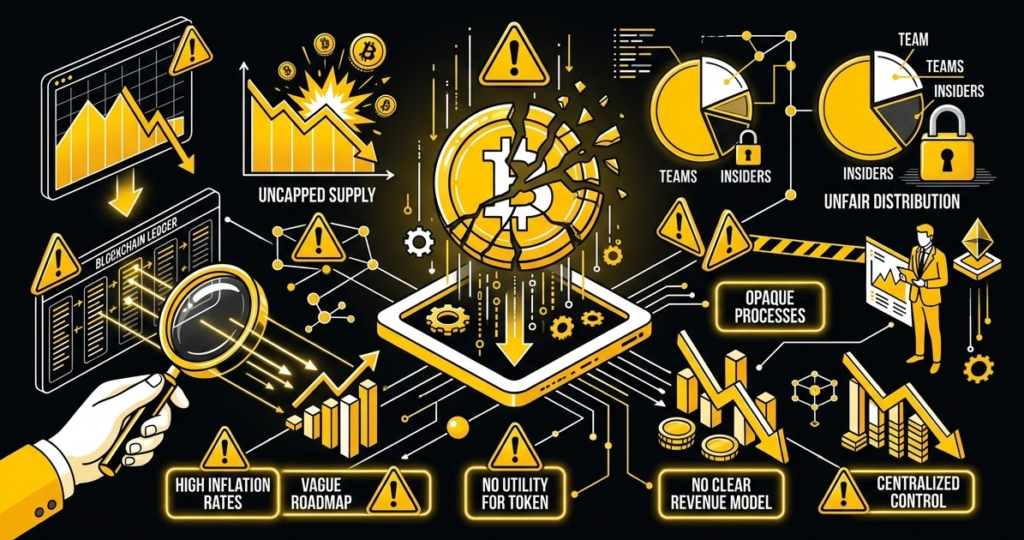
Tokenomics isn’t a crystal ball.
No supply model can tell you with certainty where a token’s price will go.
What it can do is reveal structural risks that might otherwise remain hidden.
Mercenary capital vs. organic demand
One of the most important distinctions is between organic usage and incentivized activity.
Suppose a DeFi protocol launches and promises users a 50% annual token reward for providing liquidity.
Users arrive.
Total Value Locked rises.
Trading volume increases.
The project looks fantastic on a dashboard.
But then the token emissions are reduced.
The rewards fall from 50% to 10%.
And suddenly liquidity disappears.
What happened?
The protocol may have attracted mercenary capital-capital that was primarily interested in token incentives rather than the underlying product.
That doesn’t mean incentives are inherently bad.
Early-stage protocols often need incentives to bootstrap liquidity and attract users.
The problem is relying on incentives indefinitely without developing organic demand.
A healthier model might look like:
Users → Product usage → Fees → Revenue → Sustainable incentives / value capture
A weaker model might look like:
Token emissions → Rewards → Temporary users → More token emissions
The second loop can continue for a while, but eventually the economics have to support themselves.
Watch the emission schedule
When analyzing a project, look beyond the headline supply.
You want to know how quickly tokens enter circulation.
A project with a 10 billion token supply isn’t necessarily problematic.
A project with 10 billion tokens that releases 6 billion over the next 18 months deserves closer examination.
The important variable is the rate of supply expansion relative to demand.
I often find the following questions more useful than simply asking whether supply is “high”:
- What percentage of supply is currently circulating?
- How much unlocks each month?
- How large are the upcoming cliffs?
- Who receives the tokens?
- Are staking rewards increasing supply?
- Are ecosystem incentives temporary or permanent?
- Does the protocol have a credible reason to distribute these tokens?
Tokenomist’s unlock framework similarly emphasizes the importance of tracking upcoming releases, their size, their timing, and the stakeholder categories receiving them. (Tokenomist)
Insider concentration
Distribution matters just as much as supply.
Imagine two projects with identical maximum supplies of 1 billion tokens.
Project A distributes:
- 15% to the team
- 10% to investors
- 50% to the community
- 25% to ecosystem development
Project B distributes:
- 35% to the team
- 30% to investors
- 20% to the community
- 15% to ecosystem development
They have the same maximum supply.
But their economic structures are completely different.
High insider concentration isn’t automatically malicious. Founders and early investors often need meaningful ownership to compensate for years of work and capital risk.
The question is whether the allocation is transparent, whether vesting is reasonable, and whether governance gives a small group disproportionate control.
Hidden or confusing unlock schedules
A healthy tokenomics model should make it relatively easy to understand:
- Who owns the tokens
- How many they own
- When those tokens unlock
- What happens after unlocking
- Whether allocations can be changed
- Whether governance can accelerate releases
If you have to dig through five different documents to understand when insiders can sell, that’s a reason to slow down.
Transparency is itself an economic feature.
Extreme FDV relative to current usage
A large FDV is not automatically bad.
But a huge FDV combined with minimal users, tiny revenue, limited liquidity, and substantial future unlocks should make you ask harder questions.
For example, imagine:
$20 million current market cap + $4 billion FDV + weak adoption
The token price may look cheap because the market cap is small.
But the implied future valuation could be enormous.
That’s the trap.
A low unit price does not mean a token is cheap.
A token trading at $0.10 can be more expensive on a fully diluted basis than a token trading at $100.
Price per token tells you almost nothing without supply.
A Practical Tokenomics Checklist
If you’re researching a token for the first time, I would keep the process simple.
Start with this table:
| Question | What to investigate |
|---|---|
| What is the supply? | Circulating, total, maximum |
| How fast is supply growing? | Inflation and emission schedule |
| Who owns the tokens? | Team, investors, community, treasury |
| When do tokens unlock? | Cliff and linear vesting |
| What is the FDV? | Price × maximum supply |
| Why does the token exist? | Utility and network function |
| Who needs it? | Users, validators, developers, traders |
| Does the protocol generate revenue? | Fees, subscriptions, settlement, etc. |
| Does revenue reach the token? | Burns, buybacks, staking, distributions |
| Can tokenomics change? | Governance and upgrade mechanisms |
You don’t need to answer every question perfectly.
Even answering half of them can give you a much better understanding than simply looking at a price chart.
Reading a Tokenomics Page Like an Analyst
Project websites often present tokenomics in visually attractive pie charts.
You’ll see something like:
Community – 40%
Team – 20%
Investors – 15%
Treasury – 15%
Advisors – 10%
That looks useful.
But the pie chart alone doesn’t tell you enough.
You also need the timeline.
Suppose the team allocation is 20%.
If it is locked for five years, that’s very different from a scenario where the team receives its full allocation after six months.
Likewise, a 40% community allocation sounds generous, but you need to understand what “community” means.
Does it represent:
- actual airdrops?
- future staking rewards?
- liquidity mining?
- treasury-controlled funds?
- developer grants?
- ecosystem incentives?
These categories can behave very differently.
That’s why I recommend turning the tokenomics pie chart into a timeline.
Think in terms of:
Today → 6 months → 1 year → 2 years → full unlock
Then ask how circulating supply changes at each stage.
This gives you a much more realistic picture of dilution.
Why Tokenomics and Valuation Must Be Studied Together
Tokenomics tells you about the supply and incentive structure.
Valuation tells you what the market is currently paying for that structure.
You need both.
Imagine Token A:
- $100 million market cap
- $110 million FDV
- 90% circulating
- modest future unlocks
And Token B:
- $100 million market cap
- $2 billion FDV
- 5% circulating
- massive future unlocks
Both have the same market cap.
But their supply structures are radically different.
That doesn’t tell you which project will perform better.
It tells you that they are not economically comparable based on market cap alone.
This is exactly why FDV became such a widely discussed metric during token launches.
The market capitalization may look relatively modest because only a small fraction of the supply is circulating, while the fully diluted figure exposes the valuation implied by the eventual supply.
Still, FDV has limitations too.
If a token has no realistic maximum supply, a conventional maximum-supply FDV may not be meaningful.
If the maximum supply is technically enormous but will take decades to issue, the number may exaggerate near-term dilution.
And if the project changes its monetary policy through governance, the original assumptions can become outdated.
So treat FDV as a scenario, not a prophecy.
Tokenomics Is Really About Incentive Alignment
At the deepest level, good tokenomics is about incentives.
Consider a proof-of-stake blockchain.
Validators lock tokens or otherwise commit economic value because they expect rewards.
Users pay fees because they want to use the network.
Developers build applications because they expect users and economic activity.
Token holders participate in governance because they care about the network’s direction.
Treasuries fund development because ecosystem growth can increase the usefulness of the network.
Ideally, all of these actions reinforce each other.
You get something like:
More users → More activity → More demand → Stronger economic incentives → More infrastructure → More users
That is the kind of flywheel you want to identify.
But there can also be negative loops:
High emissions → Token selling → Lower token price → Higher required incentives → More emissions
Or:
Low circulating supply → Artificial scarcity → High valuation → Large unlock → Increased sell pressure
Understanding which loop dominates is far more informative than memorizing whether a token has “good” or “bad” tokenomics.
Frequently Asked Questions About Tokenomics
What does tokenomics mean in cryptocurrency?
Tokenomics refers to the economic system governing a cryptocurrency or token, including how tokens are created, distributed, used, unlocked, and potentially removed from circulation.
The concept is broad. It can include supply caps, inflation, staking rewards, token burns, governance, vesting schedules, treasury allocations, and utility.
As CoinMarketCap’s explanation of tokenomics notes, the term covers both how a token is used within an ecosystem and the monetary policies that influence its supply over time. (CoinMarketCap)
In practical terms, think of tokenomics as the economic rulebook of a crypto project.
What is the difference between Market Cap and Fully Diluted Valuation?
Market cap is generally calculated by multiplying the current token price by its circulating supply.
FDV, or Fully Diluted Valuation, applies the current token price to the project’s maximum supply.
For example, if a token trades at $5 and has 20 million circulating tokens, its market cap is $100 million.
If its maximum supply is 100 million tokens, its theoretical FDV is $500 million.
The two metrics therefore describe different supply assumptions, which is why CoinMarketCap’s supply methodology distinguishes circulating-supply valuation from maximum-supply FDV. (Hỗ trợ CoinMarketCap)
Neither metric alone tells you whether an asset is attractively valued.
They simply give you different pieces of the valuation picture.
What is a token vesting schedule and why does it matter?
A token vesting schedule determines when tokens allocated to teams, investors, advisors, or other stakeholders become available.
It may include a cliff, where nothing unlocks for a defined period, followed by linear or periodic releases.
For example, a project could allocate tokens to its founding team with a one-year cliff followed by three years of monthly vesting.
That means the team doesn’t receive the entire allocation immediately.
Vesting matters because it affects future circulating supply and therefore the potential supply-demand balance. Tokenomist’s explanation of token vesting highlights the distinction between cliff and linear releases and the role these schedules play in controlling when stakeholder allocations become liquid. (Tokenomist)
When researching a token, I would always look beyond the allocation percentage and examine the actual unlock timeline.
What is a token unlock?
A token unlock is the point at which previously restricted tokens become available according to their vesting or release conditions.
Imagine an investor owns 10 million tokens but cannot transfer them for 18 months.
When the restriction expires, those tokens may become liquid.
That’s an unlock.
The important detail is that an unlock does not necessarily mean a sale.
The recipient could sell, hold, stake, provide liquidity, transfer the tokens, or use them within the ecosystem.
That is why it is better to describe an unlock as a change in potential market supply, rather than automatically assuming that every unlocked token will be dumped.
Current tokenomics trackers such as Tokenomist’s unlock calendar distinguish future supply releases from the subsequent decisions holders make with those assets. (Tokenomist)
How do deflationary token models work?
A deflationary model attempts to reduce the supply of a token, either permanently or relative to its issuance rate.
One common mechanism is a token burn, where tokens are permanently removed from circulation.
Ethereum’s EIP-1559 provides a prominent example: the protocol burns the base fee associated with transactions, while validators continue receiving issuance under the proof-of-stake system. (Ethereum Improvement Proposals)
The important concept is net supply change.
If a protocol issues 1 million tokens and burns 700,000, the net increase is 300,000.
If it issues 1 million and burns 1.2 million, the net supply decreases by 200,000.
So when someone tells you that a token is “deflationary,” don’t stop there.
Ask:
“Deflationary relative to what period, and because of which mechanism?”
Is a fixed maximum supply automatically good tokenomics?
No.
A fixed supply can create scarcity, but scarcity alone doesn’t create demand.
Imagine a token with a maximum supply of 1 million units but no users, no utility, no revenue, and no reason for anyone to own it.
The supply is scarce.
The economic demand is still close to nonexistent.
Bitcoin’s 21-million maximum supply is meaningful partly because it is embedded within a broader monetary and network-security system, not simply because the number 21 million is small. (CoinMarketCap)
So when evaluating tokenomics, I would treat maximum supply as one variable, not the final verdict.
What is the difference between inflation and dilution?
These concepts are related but not identical.
Inflation generally refers to an increase in the token supply over time.
Dilution describes the effect of additional supply on existing holders’ proportional ownership or the economic share represented by their tokens.
Suppose a project has 100 million tokens and you own 1 million.
You own 1% of the supply.
If the project creates another 100 million tokens and your holdings remain unchanged, you still own 1 million tokens-but now your share is only 0.5%.
Your number of tokens didn’t change.
Your proportional ownership did.
That is dilution.
This is why looking only at token balances can be misleading. You also need to know how the denominator is changing.
Does a token burn always increase the token price?
No.
A burn reduces supply, but price depends on both supply and demand.
If demand is collapsing faster than supply is being reduced, the price can still fall.
For example, imagine a token burns 10% of its supply while active users fall by 80%.
The supply-side improvement may be overwhelmed by the decline in demand.
This is why I see token burns as an economic mechanism, not a guaranteed price catalyst.
The same principle applies to buybacks.
A buyback can create additional demand for the token, but you still need to examine where the buyback money comes from and whether the protocol can sustain the mechanism.
What is “good” tokenomics?
There isn’t a universal template.
Different networks need different economic designs.
A proof-of-stake blockchain needs to reward validators.
A decentralized exchange may need liquidity incentives.
A decentralized storage network may need to compensate storage providers.
A gaming ecosystem may need an internal medium of exchange.
A governance token may prioritize voting rights rather than direct financial distributions.
So instead of asking whether tokenomics is “good” in isolation, I would ask whether the design is internally coherent.
Look for:
- Transparent supply rules
- Understandable token distribution
- Clearly documented vesting
- Reasonable emission schedules
- Genuine token utility
- Sustainable incentives
- Transparent governance
- A credible connection between network activity and token demand
- Clear value-capture mechanisms where applicable
The strongest tokenomics designs aren’t necessarily the ones with the smallest supply.
They are the ones where the economic incentives make sense.
Final Thoughts
If there is one habit I would encourage you to develop when researching crypto projects, it is this:
Follow the tokens.
Don’t stop at the whitepaper.
Don’t stop at the market cap.
Don’t stop at the token price.
Follow the entire economic journey.
Where were the tokens created?
Who received them?
How many are circulating today?
How many are locked?
When do they unlock?
How quickly is new supply being generated?
Why do users need the token?
What happens to fees?
Are tokens burned?
Are they bought back?
Are they distributed to validators?
Does protocol growth actually create additional demand?
Those questions will often tell you more than a beautifully designed project website ever could.
And remember, tokenomics isn’t a prediction machine.
It cannot tell you whether an asset’s price will rise tomorrow, next year, or ever. What it can do is help you understand the economic structure underneath the speculation.
That’s ultimately why I think tokenomics deserves far more attention than it usually gets.
Crypto markets can change their narratives overnight. A new meme can dominate social media, a protocol can suddenly become fashionable, and a token can move hundreds of percent before most people even understand what the project does.
The token supply, however, still has to follow its rules.
Unlocks still happen.
Emissions still occur.
Validators still need incentives.
Treasuries still control allocations.
Burn mechanisms still operate according to their design.
And users still need a reason to demand the asset.
Once you learn to look at crypto through that lens, tokenomics stops being a collection of intimidating terms like FDV, vesting, circulating supply, emissions, dilution, burns, and value capture.
It becomes something much simpler:
a way of understanding who gets what, when they get it, why they want it, and how the economic system changes as the network grows.
That is the real foundation of crypto token economics.